What Is Technical Analysis?
Technical analysis is the study of historical price data and trading volume to identify patterns and trends that may indicate future price movements. Unlike fundamental analysis, which focuses on the intrinsic value of an asset, technical analysis is concerned purely with what the market is telling us through its price action and trading behaviour.
While no analytical method can predict the future with certainty, technical analysis provides a structured framework for making trading decisions based on observable market data rather than speculation or emotion.
Reading Price Charts
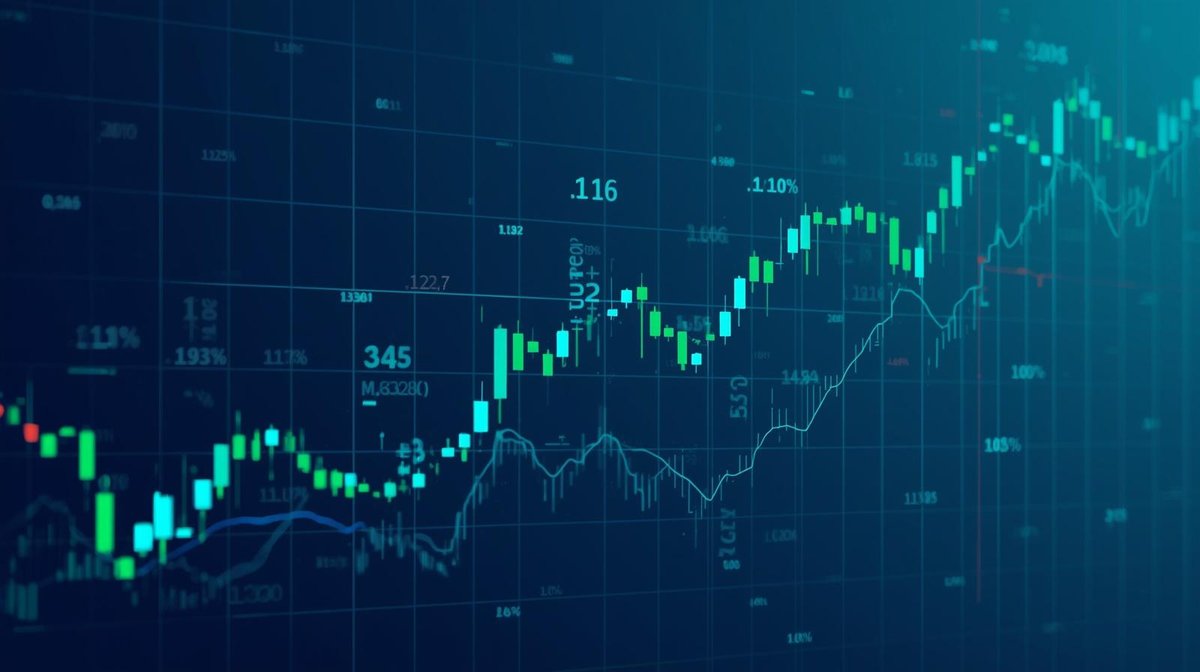
Charts are the primary tool of technical analysis. The most common chart type is the candlestick chart, where each candle represents a specific time period and shows four key data points: the opening price, closing price, high, and low. A filled (or red) candle indicates the price closed lower than it opened, while a hollow (or green) candle indicates the price closed higher.
Learning to read candlestick charts fluently is the foundation upon which all other technical analysis skills are built. Start with daily charts of well-known assets and simply observe how prices move over weeks and months before attempting to trade based on chart patterns.
Trend Identification
One of the most important concepts in technical analysis is the trend — the general direction in which an asset's price is moving. An uptrend is characterised by a series of higher highs and higher lows, while a downtrend shows lower highs and lower lows. A sideways or range-bound market moves horizontally between defined support and resistance levels.
The adage "the trend is your friend" reflects one of the most reliable principles in technical analysis: trading in the direction of the prevailing trend generally produces better outcomes than attempting to pick tops and bottoms.
Key Technical Indicators
Moving Averages smooth out price data to reveal the underlying trend. The 50-day and 200-day simple moving averages are widely followed by institutional and retail traders alike. When the shorter moving average crosses above the longer one, it is often interpreted as a bullish signal, and vice versa.
Relative Strength Index (RSI) measures the speed and magnitude of recent price changes, typically on a scale of 0 to 100. Readings above 70 are traditionally considered overbought, while readings below 30 are considered oversold. However, these levels should be used as guideposts rather than mechanical trading signals.
MACD (Moving Average Convergence Divergence) tracks the relationship between two moving averages and generates signals based on their convergence and divergence. The MACD is particularly useful for identifying changes in momentum and potential trend reversals.
Support and Resistance
Support and resistance levels are price points where buying or selling pressure has historically been strong enough to halt or reverse the prevailing trend. Support represents a floor below which the price has struggled to fall, while resistance represents a ceiling above which the price has struggled to rise. These levels often become self-fulfilling prophecies as many traders watch the same levels and act accordingly.
Putting It All Together
The most effective approach to technical analysis combines multiple indicators and tools rather than relying on any single signal. Develop a systematic approach that suits your trading style, backtest it against historical data, and apply it consistently with proper risk management. Technical analysis is a skill that improves with practice and experience.
Ready to Put This Knowledge Into Practice?
Open your free mQuanture account and access professional trading tools, real-time analytics, and expert guidance.
Open Free Account